8 Operating Profit
By primary gear, scallop dredge has considerably higher mean and median operating profit than other gear groups. Trawl has the second highest mean and median values, followed by longline, pot/trap, gillnet, and handgear. For most gear types, mean values greatly exceed median values, indicating skewness in the distribution to the right. The boxplots emphasize the range of operating profit by gear group with the box extending past $750K for scallop dredge and ~$400k for trawl. Gillnet, longline, and pot/trap extend considerably less and handgear is close to $0. A small number of observations exhibit negative operating profit, which generally is viewed as the short-term shutdown point in which continuing operations is no longer economically viable. These observations may be explained in part by other vessel uses outside of commercial fishing. For example, if a vessel is used for leisure activities, the vessel owner may have listed costs associated with activities that do not generate revenue. These vessels tend to belong to the handgear and pot/trap gear groups.
| Gear | Response | Sample | Response (%) | Mean | Median | Standard Deviation |
|---|---|---|---|---|---|---|
| Gillnet | 9 | 89 | 10% | $43,971 | $27,782 | $76,150 |
| Handgear | 53 | 365 | 15% | $8,201 | $3,572 | $59,763 |
| Longline | 4 | 24 | 17% | $119,021 | C* | C* |
| Pot/Trap | 158 | 1347 | 12% | $77,796 | $54,422 | $129,058 |
| Scallop Dredge | 28 | 219 | 13% | $493,407 | $454,378 | $401,097 |
| Trawl | 26 | 190 | 14% | $324,880 | $269,715 | $369,360 |
| Note: | ||||||
| C* indicates data not presented to protect confidentiality |
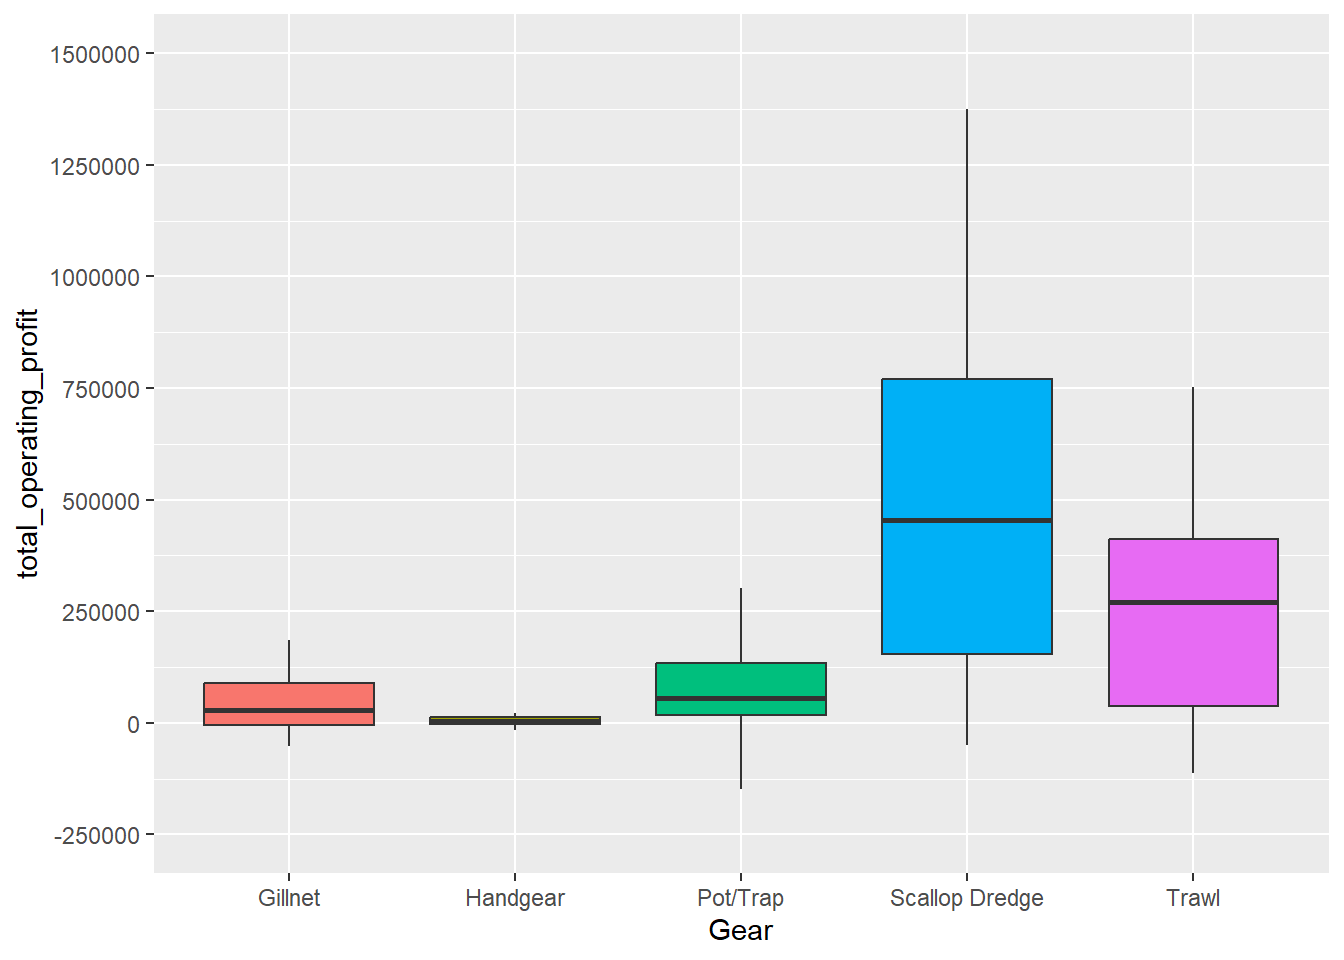
Figure 8.1: Distribution of Operating Profit by Primary Gear
By FMP, scallop has higher mean and median operating profit than all other fisheries. Squid, mackerel, butterfish has the second highest mean values, while groundfish has the third highest mean values. For a number of fisheries, mean values greatly exceed median values, indicating skewness in the distribution to the right. The boxplots emphasize the range of operating profit by gear group with the box extending past $750K for scallop and close to $400k for groundfish and squid, mackerel, butterfish. Lobster extends to ~100k and other fisheries are close to $0. A small number of observations exhibit negative operating profit, which generally is viewed as the shutdown point in which continuing operations is no longer economically viable. These observations may be explained in part by other vessel uses outside of commercial fishing. For example, if a vessel is used for leisure activities, the vessel owner may have listed costs associated with activities that do not generate revenue. Many of these vessels belong to the Highly Migratory Species fishery.
| Fishery | Response | Sample | Response (%) | Mean | Median | Standard Deviation |
|---|---|---|---|---|---|---|
| Channeled Whelk | 3 | 23 | 13% | $35,976 | C* | C* |
| Dogfish | 3 | 22 | 14% | $2,757 | C* | C* |
| Groundfish | 7 | 52 | 13% | $348,830 | $204,553 | $412,121 |
| Herring | 4 | 6 | 67% | $282,115 | C* | C* |
| Highly Migratory Species | 34 | 196 | 17% | $20,104 | $2,818 | $88,254 |
| Lobster | 151 | 1274 | 12% | $78,620 | $55,218 | $130,152 |
| Monkfish | 3 | 20 | 15% | $498 | C* | C* |
| Scallop | 28 | 227 | 12% | $493,407 | $454,378 | $401,097 |
| Squid, Mackerel, Butterfish | 9 | 60 | 15% | $358,850 | $265,778 | $427,115 |
| Striped Bass | 12 | 65 | 18% | $10,502 | $4,116 | $25,420 |
| Summer Flounder, Scup, Black Sea Bass | 24 | 135 | 18% | $115,178 | $13,751 | $220,120 |
| Note: | ||||||
| C* indicates data not presented to protect confidentiality |
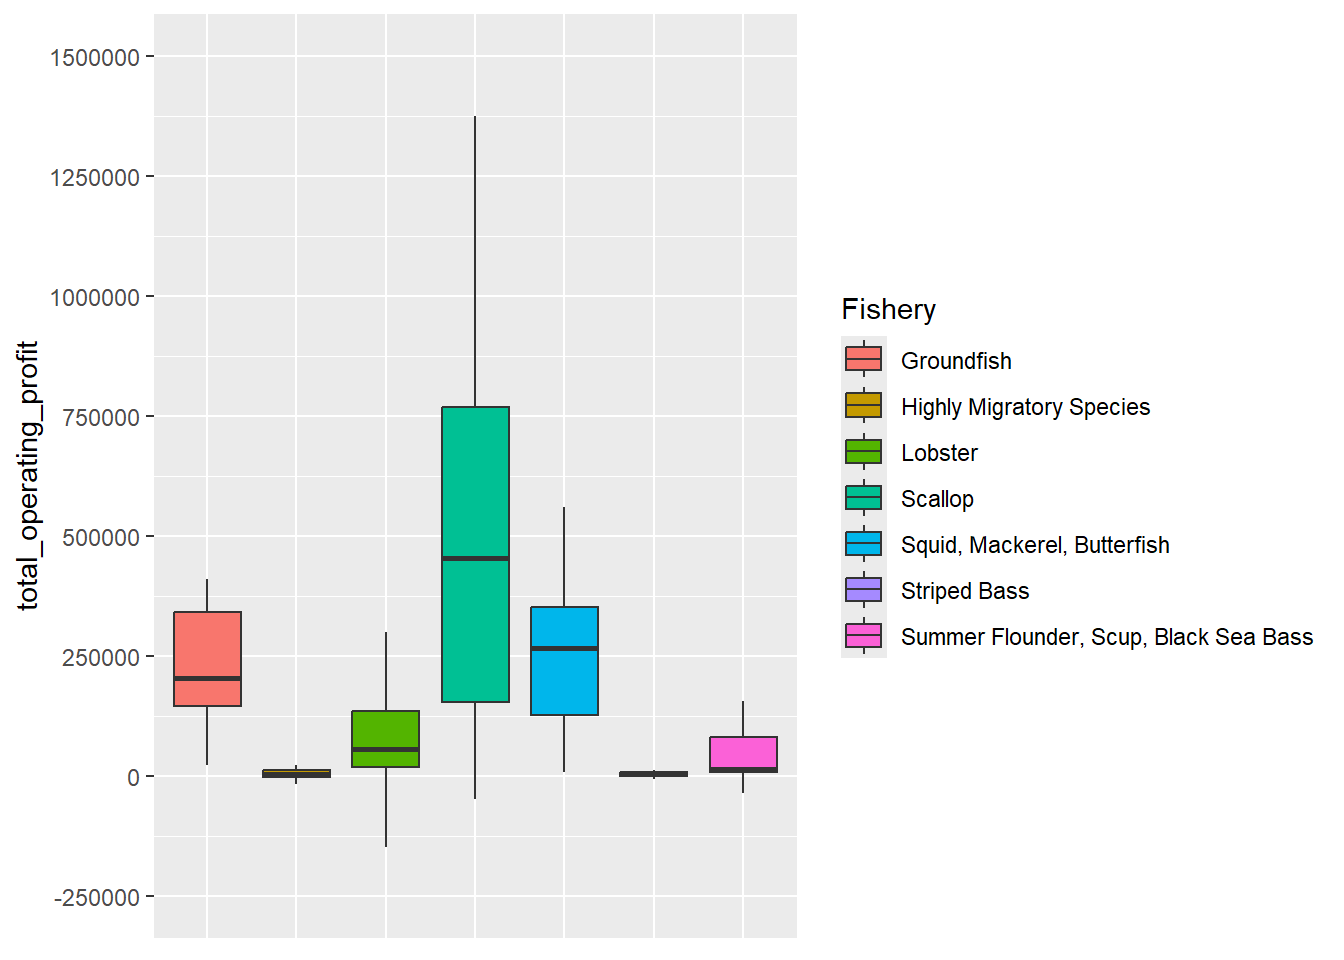
Figure 8.2: Distribution of Operating Profit by Primary Fishery
When primary gear and FMP are combined, scallop dredge-scallop has the highest mean and median operating profit. Within primary gear types, a considerable difference in operating profit is found across fisheries. For example, the mean value for squid trawl vessels is substantially higher than the value for fluke, black sea bass, and scup trawl vessels. Within the pot/trap gear group, summer flounder, black sea bass, scup vessels have a higher mean value than for lobster but a lower median value. A small number of observations exhibit negative operating profit, which generally is viewed as the shutdown point in which continuing operations is no longer economically viable. These observations may be explained in part by other vessel uses outside of commercial fishing. For example, if a vessel is used for leisure activities, the vessel owner may have listed costs associated with activities that do not generate revenue.
| Gear-Fishery | Response | Sample | Response (%) | Mean | Median | Standard Deviation |
|---|---|---|---|---|---|---|
| Gillnet-Monkfish | 3 | 20 | 15% | $498 | C* | C* |
| Gillnet-Other | 6 | 69 | 9% | $65,707 | $63,616 | $85,590 |
| Handgear-Highly Migratory Species | 31 | 184 | 17% | $7,391 | $1,308 | $76,879 |
| Handgear-Other | 3 | 71 | 4% | $35,549 | C* | C* |
| Handgear-Striped Bass | 10 | 54 | 19% | $3,077 | $1,615 | $6,043 |
| Handgear-Summer Flounder, Scup, BSB | 9 | 56 | 16% | $7,567 | $8,899 | $18,680 |
| Longline-Highly Migratory Species | 3 | 10 | 30% | $151,477 | C* | C* |
| Pot/Trap-Lobster | 149 | 1268 | 12% | $78,230 | $55,218 | $130,676 |
| Pot/Trap-Summer Flounder, Scup, BSB | 6 | 23 | 26% | $87,930 | $30,818 | $119,800 |
| Pot/Trap-Whelk | 3 | 23 | 13% | $35,976 | C* | C* |
| Scallop Dredge-Scallop | 28 | 215 | 13% | $493,407 | $454,378 | $401,097 |
| Trawl-Groundfish | 5 | 41 | 12% | $458,601 | $273,651 | $447,936 |
| Trawl-Other | 4 | 40 | 10% | $190,784 | C* | C* |
| Trawl-Squid, Mackerel, Butterfish | 8 | 53 | 15% | $402,767 | $279,961 | $434,339 |
| Trawl-Summer Flounder, Scup, BSB | 9 | 56 | 16% | $240,955 | $56,052 | $314,009 |
| Note: | ||||||
| C* indicates data not presented to protect confidentiality |
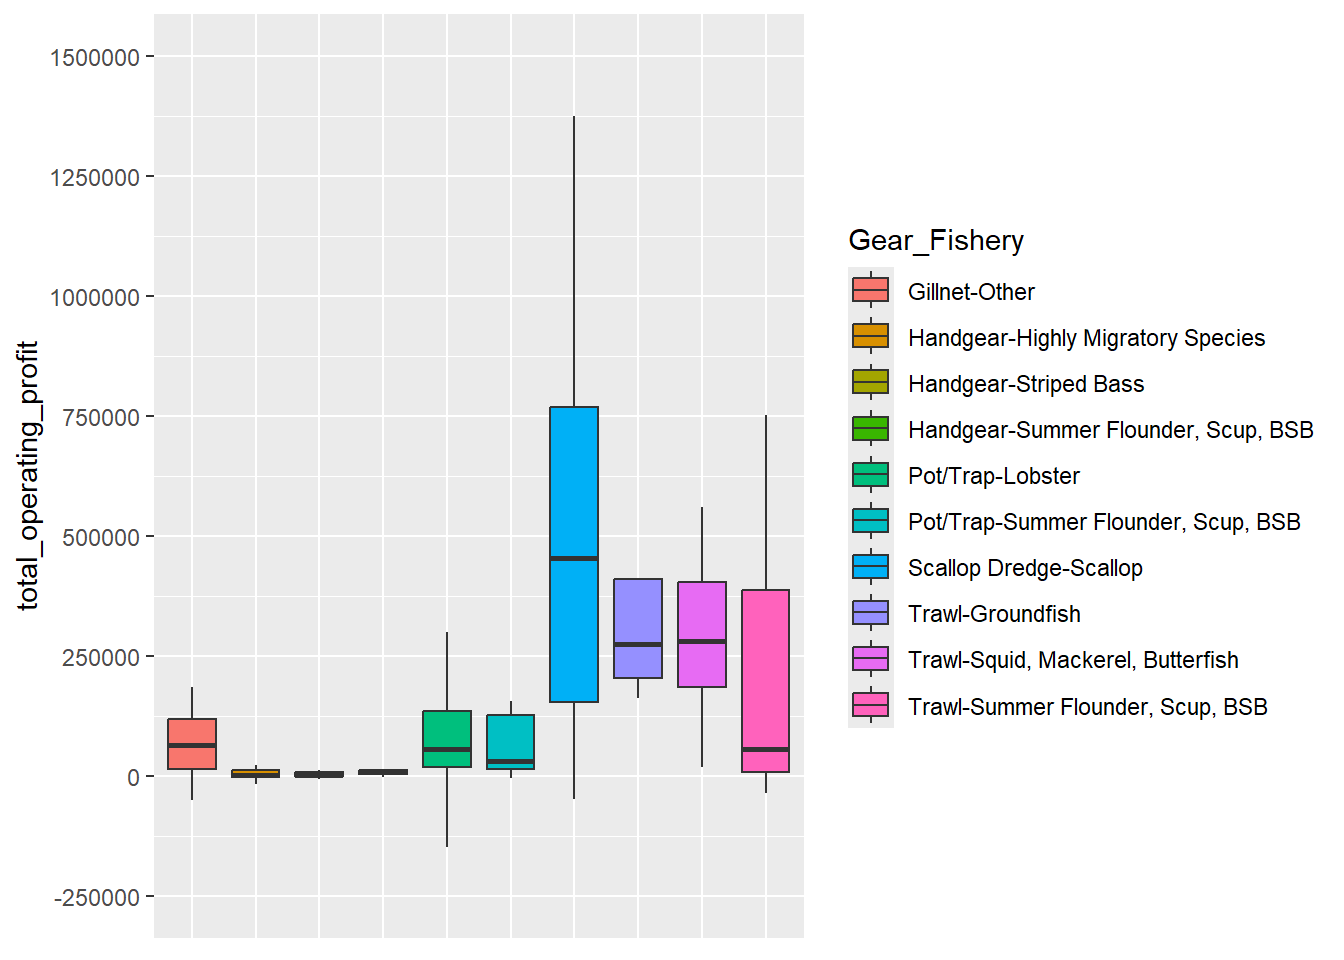
Figure 8.3: Distribution of Operating Profit by Primary Gear/Fishery